Run locally
Intro to Kubernetes and Helm
Kubernetes (k8s) allows you to deploy containerized applications while letting you abstract the underlying infrastructure. The configuration of your application and how you run it is communicated to k8s via yaml files.
Helm allows to template these yaml files. Such a templated description of an application like diracx is called chart. Helm also allows to manage dependencies between charts. For example, the diracx application needs a database to run, so the diracx charts has a dependency on the mysql charts.
To understand this chart you will need to familiarize yourself with a few k8s concepts:
- A
nodeis one of the machine (VM, physical) which sustains your k8s cluster. - Your application runs inside a container which is part of a
pod. Apodis the atomic unit with which kubernetes will work, and in most cases it corresponds to a single container.podsare deployed onnodes. - A
ReplicaSetrepresents how manypodsof a given type you want to run. For example, you want to run 3podscontaining thediracxcontainer for redundancy reasons. - A
Deploymentis how you describe your workload to k8s. It ensures that any number of replicas of yourpodare running (viaReplicaSEt). This chart contains adeploymentfordiracx(see here), and adeploymentfordiracx-web(see here). Kubernetes will always make sure that thedeploymentis satisfied. - A
Serviceis how you expose yourDeployment. If I want to talk to mydiracxapplication, it is aServicewhich will take care of redirecting me within the cluster to one of thepod. Most of the time, theServiceis used for routing inside the cluster - An
Ingressexposes yourServicesoutside of the cluster.
If you are not familiar with the above concepts, we recommend you follow the Kubernetes tutorial.
Running DiracX locally
It is possible to run an instance of DiracX locally for demo or testing purposes. This entails running a local kubernetes cluster, installing this helm chart and all its dependencies, and configuring it accordingly.
Warning
This setup is not suitable for a production or long-lived deployment. To learn how to run a long-lived deployment, see the how-to.
In order to make that easy, we wrote the run_demo.sh script, which covers all these needs. This is also used for the diracx ci
run_demo.sh
This is the script used to start a demo or the integration tests.
Once ready, you will get some information on how to interact with your cluster
NOTES:

🚧 Chart has been installed in developer mode.

ℹ️  To interact with the cluster directly using kubectl/helm you'll need to set the
first following environment variables:

  export KUBECONFIG=/home/chaen/dirac/diracx-project/diracx-charts/.demo/kube.conf
  export HELM_DATA_HOME=/home/chaen/dirac/diracx-project/diracx-charts/.demo/helm_data
  export PATH=${PATH}:/home/chaen/dirac/diracx-project/diracx-charts/.demo

Then see the chart README for more information on how to use kubectl/helm.

ℹ️  To use the demo with the DiracX client set:

  export DIRACX_URL=https://172.18.0.1.nip.io:8000
  export DIRACX_CA_PATH=/home/chaen/dirac/diracx-project/diracx-charts/.demo/demo-ca.pem

ℹ️  To use the demo with a DiracX client without local installation:

  kubectl exec -it  deployment/diracx-demo-cli -- bash

ℹ️  To access the web application visit:

  https://172.18.0.1.nip.io:8000

ℹ️  To access the interactive API documentation visit:

  https://172.18.0.1.nip.io:8000/api/docs

ℹ️  When prompted to login the credentials are:

  Username: admin@example.com
  Password: password

ℹ️  Grafana dashboard for telemetry (if enabled)

  https://172.18.0.1.nip.io:32004

  Username: admin
  Password: run ``kubectl get secrets diracx-demo-grafana -o jsonpath="{.data.admin-password}" | base64 --decode ; echo``

🦄 Waiting for installation to finish...
pod/diracx-demo-7fd5c47cd6-mq8s7 condition met
🎉 🎉 🎉 Pods are ready! 🎉 🎉 🎉
🦄 Creating initial CS content ...
Writing back configuration to /cs_store/initialRepo/default.yml
Successfully added vo to git+file:///cs_store/initialRepo
Writing back configuration to /cs_store/initialRepo/default.yml
Successfully added user to git+file:///cs_store/initialRepo

ℹ️  Press Ctrl+C to clean up and exit
Interacting with the demo
Kubernetes basics
Assuming you have exported the environment variables printed by the demo script you can interact with the demo cluster using:
# List the running pods
kubectl get pods
# Get some more information about a pod
kubectl describe pod/<pod name>
# Show the logs of a running pod
kubectl logs <pod name>
# Show the logs of a running pod and keep following them
kubectl logs -f <pod name>
# Run a command in one of the pods
kubectl exec -it <pod name> -- /bin/bash /entrypoint.sh
Helm basics
When running the demo, an values.yaml file is created as .demo/values.yaml.
This file can be used with helm to interact with the running demo to make changes to what is running in the cluster.
# Show what will be changed by running "helm upgrade"
# Note: helm diff has a ``bug`` that requires you to specify the existing password
# https://github.com/databus23/helm-diff/issues/460

export RABBITMQ_PASSWORD=$(kubectl get secret --namespace "default" rabbitmq-secret -o jsonpath="{.data.rabbitmq-password}" | base64 -d)
export MYSQL_ROOT_PASSWORD=$(kubectl get secret --namespace "default" mysql-secret -o jsonpath="{.data.mysql-root-password}" | base64 -d)
export MYSQL_PASSWORD=$(kubectl get secret --namespace "default" mysql-secret -o jsonpath="{.data.mysql-password}" | base64 -d)

helm diff upgrade diracx-demo  ./diracx --values .demo/values.yaml --set rabbitmq.auth.password=$RABBITMQ_PASSWORD  --set mysql.auth.rootPassword=$MYSQL_ROOT_PASSWORD --set mysql.auth.password=$MYSQL_PASSWORD

# Actually run "helm upgrade" to apply changes
helm upgrade diracx-demo ./diracx --values .demo/values.yaml
See here for more details on what you can do to alter the behavior of the local installation.
OpenTelemetry
Experimental: opentelemetry is an evolving product, and so is our implementation of it.
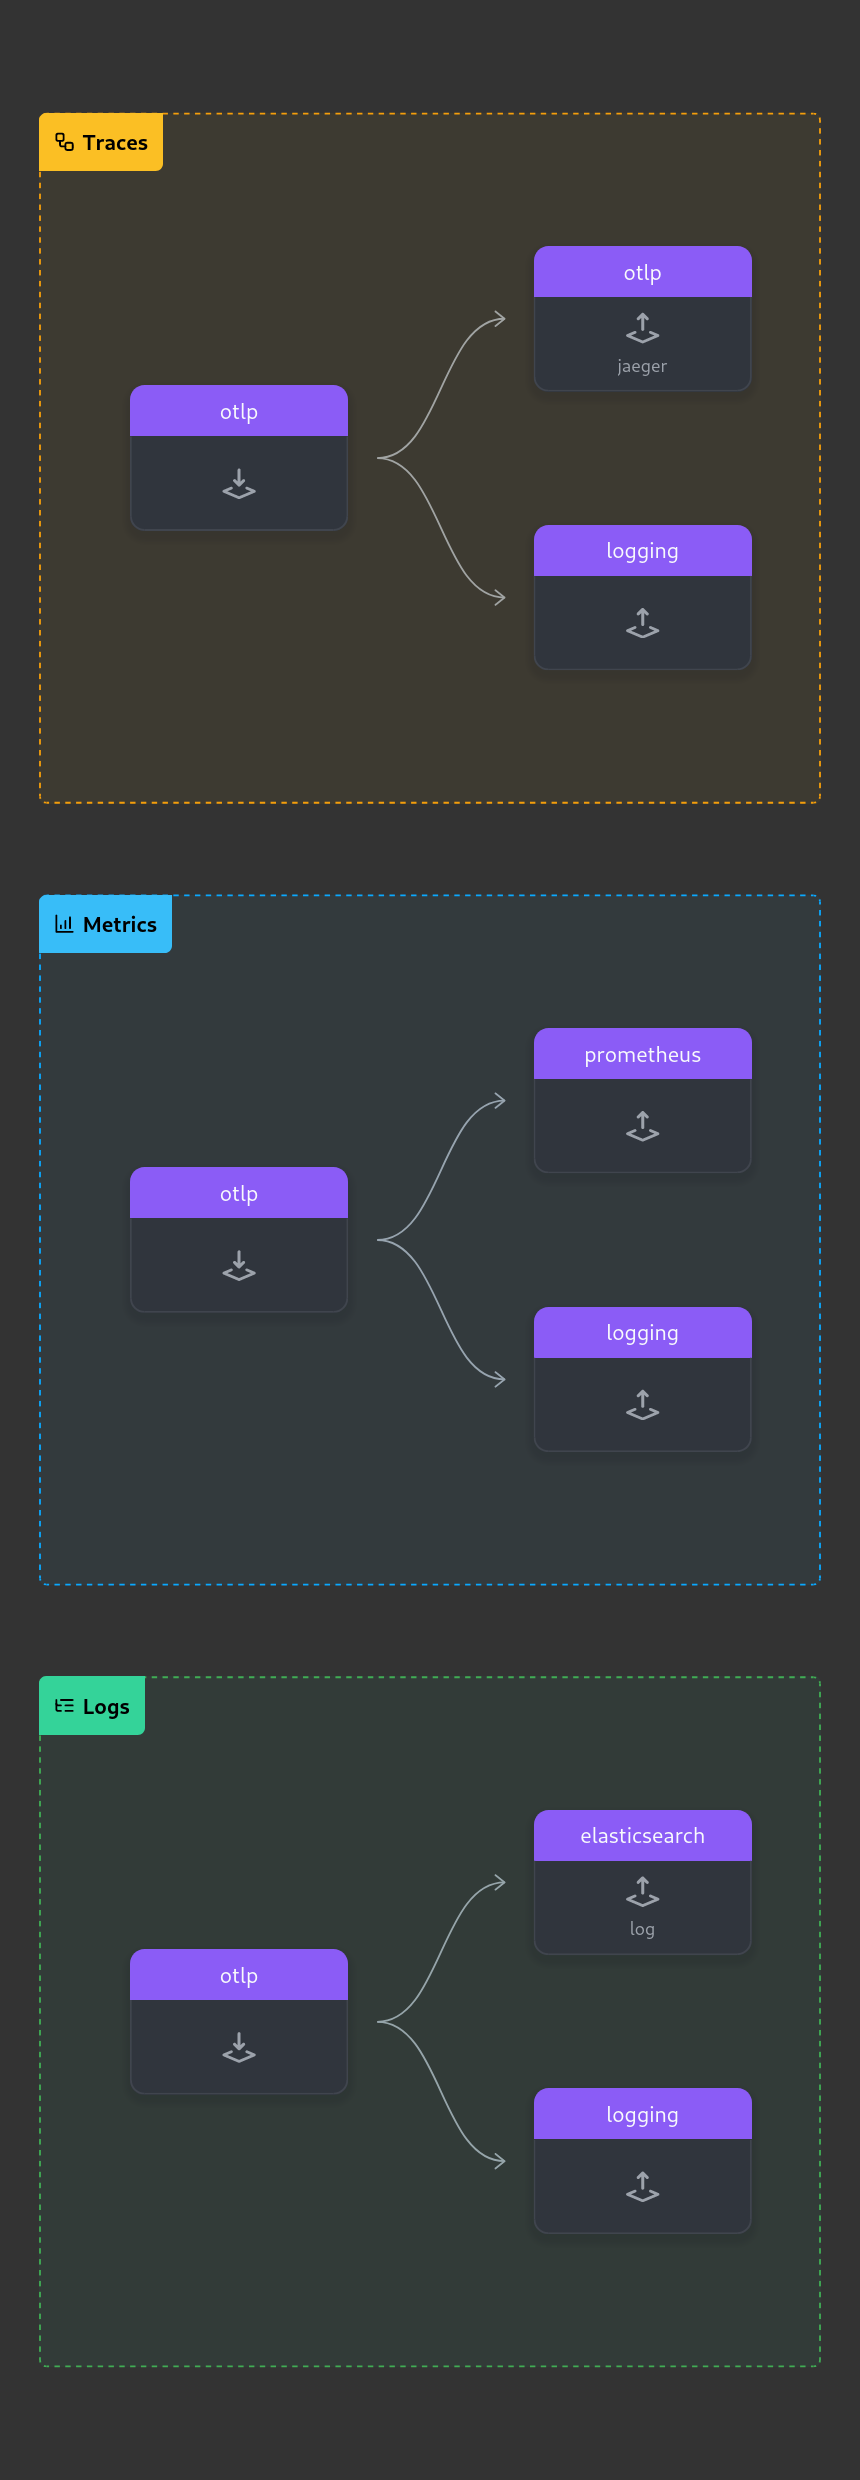
diracx aim at relying on OpenTelemetry for traces, monitoring and logging. When running in demo mode, this chart can spawn the necessary component for the telemetry to be reported:
* OpenTelemetry-collector to collect all the data
* Prometheus for the metrics
* Jaeger for traces
* ElasticSearch for logs (OpenSearch not yet supported)
* Grafana to display all that (accessible on port 32004 of the demo)
To enable it, run run_demo.sh with enable-open-telemetry
Note that this configuration is trivial and does not follow production recommandations (like using batch processing)